
October 16, 2024
By William Maher, Director of Strategy and Research, RFA; Scot Bommarito, Senior Research Associate, RFA; Nolan Eyre, Research Analyst, RFA
Originally published via AFIRE
The NCREIF Open End Diversified Core Equity Fund Index can offer a critical glimpse into which types of office properties—and which markets—have suffered the most in terms of leasing occupancy, and where the market might go next.
The US office market has been in the news for the last few years due to the large decline in office usage following the COVID-19 shut-downs. More recently, focus has shifted to the financial distress being felt by property owners and the cities that rely on office tax revenues.
This article explores which types of office properties and which markets have suffered the most in terms of leasing occupancy. We focus on so-called institutional properties that are part of the NCREIF Open End Diversified Core Equity Fund Index (NFI-ODCE), a $280 billion index pool whose investors mainly consist of pension funds.[1]
For all US office buildings that are tracked by CoStar, occupancy has fallen to 86.3% as of Q1 2024 from an average of 90.7% in 2019. Over the same timeframe, ODCE office occupancy fell from 90.3% to 82.9%; a steeper decline of 7.4PPTS.[2] Additionally, as of June 2024, there are nineteen office REITs with a combined market value of $64 billion.[3] REIT office occupancy fared somewhat better than ODCE properties, falling 5.7PPTS from 93.4% in 2019 to 87.7% in Q1 2024.[4]
The steep decline in ODCE office occupancy is particularly notable, given that the index consists of stabilized properties in open-ended real estate funds that deploy lower-risk investment strategies. Four- and five-star office buildings, as defined by CoStar, experienced a similar drop in occupancy, and both performed worse than the overall office sector and REITs. While recent trends, including remote work, have negatively impacted the overall sector, ODCE office properties appear to be particularly struggling. Despite the overall downward trend, occupancy rates for ODCE office vary by office subtype, building vintage, and geography, suggesting a differentiated outlook on the state of the office market.
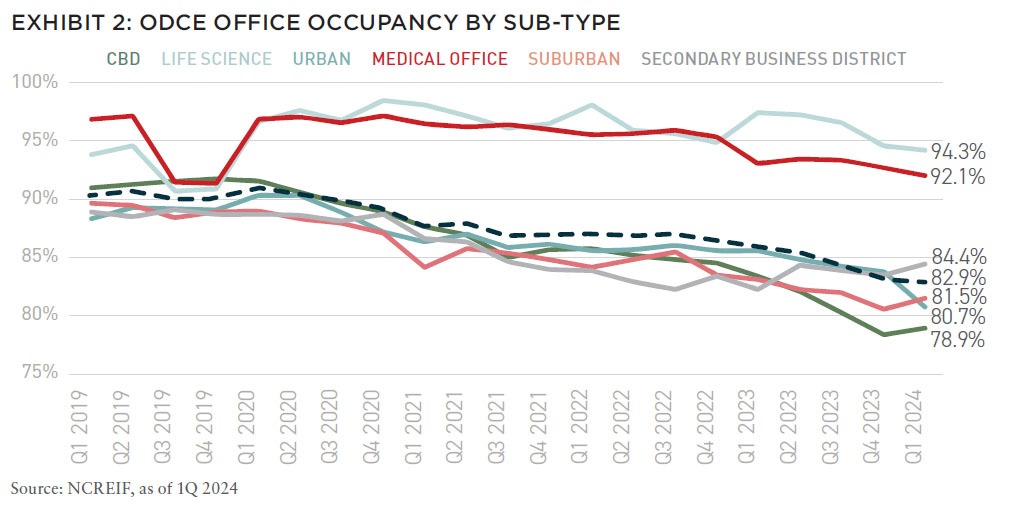
Major Office Categories
NCREIF and other market data collectors have broken out the office sector into several subtypes, including some that have been introduced quite recently. Central business districts (CBDs), the largest office subtype in the ODCE index, have registered the greatest occupancy declines. In 2019, CBD occupancy averaged 91.4%; the highest of the traditional office subtypes. Since then, CBD occupancy rates have dropped by 12.5PPTS to 78.9%; the lowest of all subtypes.
Urban and suburban office occupancy rates declined less dramatically, falling 8.3PPTS and 7.6PPTS, respectively. Secondary business districts (SBD), the smallest office subtype, registered the highest occupancy rates and the smallest declines of the four traditional office subtypes, with Q1 occupancy at 84.4%, 4.4PPTS down from 2019 averages. Except for SBDs, traditional office occupancies have fallen below their GFC-era lows, underscoring the unique headwinds facing the sector today, particularly in CBDs.
The alternative office subtypes, life science and medical office, have historically enjoyed higher occupancies than traditional office subtypes. Life science is the second largest ODCE office subtype and had the highest occupancy rate in Q1 2024 at 94.3%. It is the only subtype to record an occupancy increase since 2019, up 1.7PPTS. Medical office recorded the second highest occupancy rate of 92.1%, down 2.2PPTS.
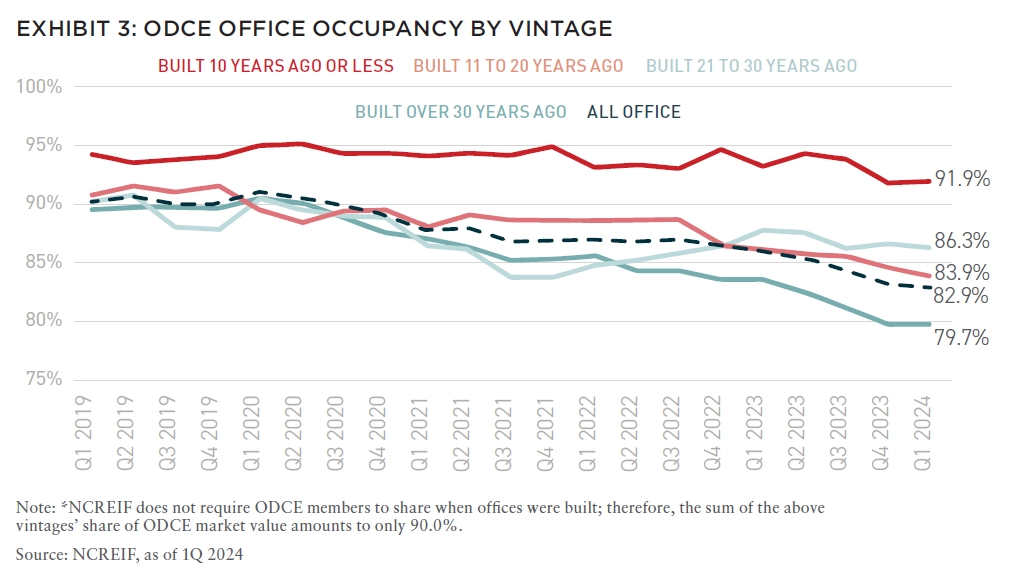
Occupancy By Year Built
ODCE office occupancy also varies by when it was constructed (vintage). Not surprisingly, office buildings constructed in the past ten years, sometimes referred to as “Next Generation” or “Next Gen” office, have maintained the highest occupancies. In Q1 2024, Next Gen office occupancy was 91.9%, well above the sector’s overall occupancy but down 2.0PPTS from its 2019 average. Office buildings built eleven to twenty years ago have also fared moderately well with occupancies averaging 86.3%, despite falling 2.9PPTS. This vintage fell to a low occupancy of 83.7% at the end of 2021 before recovering to its current rate. Occupancy in offices built 21 to 30 years ago is down by a larger margin of 7.4PPTS from 2019 but remains slightly above the overall sector average at 83.9%. Much of the occupancy decline in this vintage started in late 2022.
Older office (built more than thirty years ago) has recorded the worst performance across vintages. Occupancies have declined steadily for the last five years, falling a cumulative 10.1PPTS to 79.7% in Q1 2024. This vintage makes up over half of ODCE office, significantly dragging down overall occupancy.
The gap between the best and worst performing office vintages has widened considerably in the wake of the pandemic. In 2019, occupancy in the best performing vintage was 4.7PPTS higher than in the worst performing vintage. In Q1 2024, that spread widened to 12.3PPTS. This trend suggests a continued bifurcation in the office sector as tenants’ “flight to quality” boosts performance in newer office buildings at the expense of older buildings.
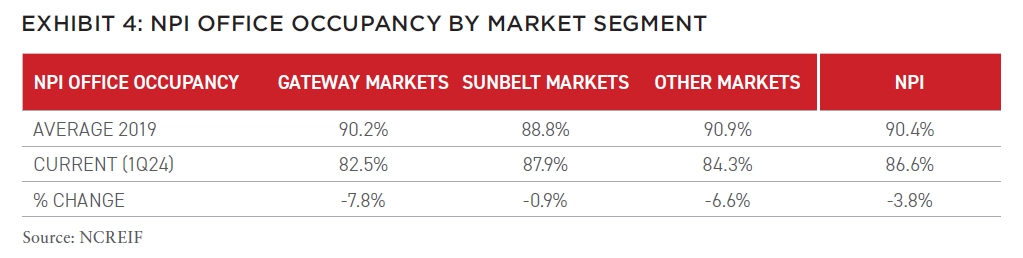
Occupancy By Region and Metro
Office performance varies widely across markets consistent with data and reports about actual office utilization.[5] Gateway markets have been particularly hard hit by declining office occupancy rates. Between 2019 and Q1 2024, gateway market NPI office occupancy fell 7.8PPTS from 90.2% to 82.5%, below the overall NPI office occupancy rate of 86.6%. In contrast, Sunbelt markets experienced only a slight drop of 0.9PPTS over the past five years, and occupancy currently stands at 87.9%. The divergence of the two market groupings is notable as gateway markets had higher occupancy rates than Sunbelt markets in 2019. Other markets, encompassing markets in various regions, also saw a significant drop, with occupancy falling from 90.9% in 2019 to 84.3% in Q1 2024; a decrease of 6.6PPTS.
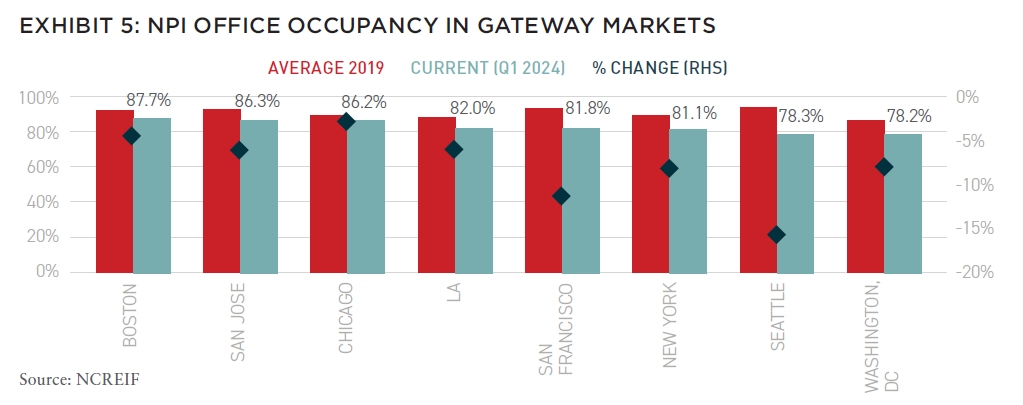
Among gateway markets, the sharpest occupancy declines were in Seattle (15.7PPTS) and San Francisco (11.3PPTS). New York and Washington, DC also experienced meaningful drops in occupancy, with declines of 8.1 and 8.0PPTS, respectively. Among gateway markets, Washington, DC recorded the lowest office occupancy in Q1 2024 at 78.2%, partly due to the federal government’s lenient work from home policies. Boston posted the highest occupancy at 87.7%, with a modest five-year decline of 4.5PPTS, partly due to its strong life science sector. Chicago experienced the smallest drop in office occupancy among gateway markets, falling just 2.9 percentage points, and it maintained a relatively high occupancy rate of 86.2%. Los Angeles and San Jose also reported more modest declines in occupancy.
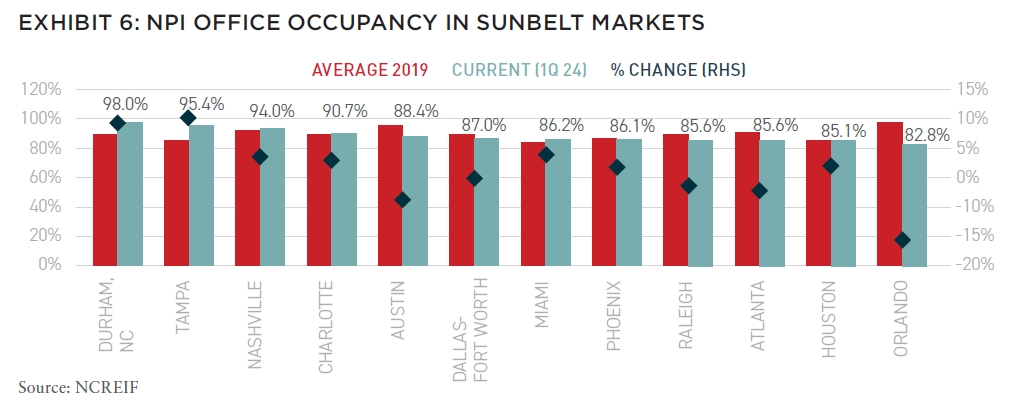
Office occupancies were more favorable in most Sunbelt markets relative to their gateway market peers. NPI office occupancy was highest in Durham at 98.0%, although the market is home to only nine NPI office properties. Tampa and Nashville stand out as particularly strong office markets with Q1 2024 occupancy rates at 95.4% and 94.0%, respectively. Over the past five years, Tampa recorded the largest occupancy increase of 9.4PPTS.
Performance in Dallas, the largest Sunbelt NPI office market, was comparable to Chicago among the gateway markets; occupancy fell 2.6PPTS to 87.0%. Orlando and Austin had the largest declines in occupancy rates since 2019, down 15.0PPTS and 6.9PPTS, respectively. Austin occupancy remained well above the overall average at 88.4%, but Orlando occupancy fell to 82.8%, the lowest of all Sunbelt markets. Orlando’s dramatic decrease suggests that a few office buildings in the market may be either particularly troubled or in lease-up.
Tenants increasingly opt for newer, best-in-class offices, with large tenants particularly drawn to Next Gen buildings.
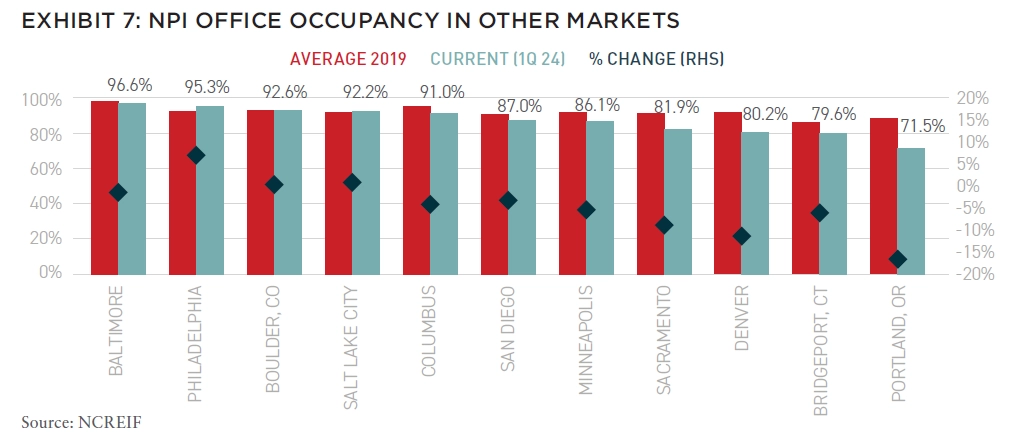
Performance was mixed across other nongateway, non-Sunbelt markets. Baltimore recorded the highest occupancy rate in Q1 2024 at 96.6% despite falling 1.4PPTS from 2019. Philadelphia followed at 95.3%, driven by a significant increase of 6.8PPTS above its 2019 rate. The Western markets of Boulder, Colorado and Salt Lake City also saw slight increases in occupancy and enjoyed rates above 92%.
In the Midwest, Columbus and Minneapolis recorded occupancy declines but maintained rates above the overall average in Q1 2024. Occupancies declined by the largest margins in Portland (16.8PPTS), Denver (11.4PPTS), and Sacramento (8.8PPTS). Portland recorded the lowest occupancy rate of all markets analyzed at just 71.5% in Q1 2024.
Fundamentals to Watch
Office fundamentals remain challenged amid shifting work trends, and occupancy rates reflect these sectoral headwinds both in private and public real estate. ODCE office has been particularly hard hit compared to the broader sector and REITs. Despite the overall downturn in the sector, a closer analysis reveals variation within the office space.
In the ODCE index, CBD, the largest subtype, has been the hardest hit, with sharp occupancy declines since 2019. Non-traditional office subtypes have fared better, particularly medical office and life science. The performance of life science is driven by strong demand drivers, including robust biotech employment growth, investment in new drugs and biologicals, and a high number of clinical trials underway for new drugs. Life science fundamentals remain much stronger than the overall office sector, although they have recently moderated due to elevated supply pipelines. Medical office also benefits from several strong demand drivers, including a rise in the elderly population and the continued shift to outpatient care.
Newer office buildings have also outperformed older vintages, with the occupancy gap between them widening significantly in recent years. Tenants increasingly opt for newer, best-in-class offices, with large tenants particularly drawn to Next Gen buildings. Older vintages have in turn suffered from low demand. Occupancy is lowest among buildings built over 30 years ago, which constitute over half of ODCE office, and these older buildings are largely responsible for the fall in occupancy over the past 5 years.
Although opportunities to renovate older buildings exist, structural deficiencies and restrictive floorplates make them difficult. A dilemma for the office market is that tenants prefer newer buildings, but overall sector weakness will make new construction generally uneconomic.
Geographically, the once-dominant gateway markets have registered notable occupancy declines and have been overtaken by several Sunbelt markets. The impacts of remote work may be partly responsible for low occupancy in gateway markets where the model is popular, including in the Bay Area and Washington, DC. It is unclear if Sunbelt office markets will continue to outperform their gateway peers, but population trends, especially migration of young residents and workers, will likely bolster Sunbelt real estate fundamentals across the board.
The broad trend of declining office performance looks unlikely to subside in the near term. However, not all segments of the sector will suffer equally, and investors may find attractive opportunities in select sub-sectors.
About The Authors
Bill Maher leads RCLCO Fund Advisors’ research efforts and investment strategy for institutional clients. He brings a wealth of knowledge and perspective from his decades-long experience as a respected economist and thought-leader in the real estate industry. Scot Bommarito researches real estate and economic trends to develop RCLCO Fund Advisors’ points of view on the economy, capital markets, and property markets. Nolan Eyre supports RCLCO Fund Advisors’ Strategy and Research team, focusing on economic issues affecting the real estate industry.
References
[1] NFI-ODCE is a capitalization-weighted, gross of fee, time-weighted return index of open end real estate funds that utilize lower risk investment strategies utilizing low leverage and are generally represented by equity ownership positions in stable US operating properties diversified across regions and property type.
[2] Source: NCREIF. NCREIF ODCE figures in this article differ from those in the Nareit market commentary because they are based on NCREIF’s new property type definitions for ODCE, whereas Nareit used the legacy definitions.
[3] Source: Nareit REITWatch, June 2024.
[4] Pierzak, Edward F. “REIT Prowess: Occupancy Rates Showcase REIT Asset Selection and Management.” Reit.com, Nareit, 14 June 2024, https://www.reit.com/news/blog/ market-commentary/reit-prowess-occupancy-rates-showcase-reit-asset-selection-and. Accessed 1 July 2024.
[5] Due to data limitations, NPI data were utilized for an analysis of office occupancy by market instead of ODCE data.
Disclaimer: Reasonable efforts have been made to ensure that the data contained in this Advisory reflect accurate and timely information, and the data is believed to be reliable and comprehensive. The Advisory is based on estimates, assumptions, and other information developed by RCLCO from its independent research effort and general knowledge of the industry. This Advisory contains opinions that represent our view of reasonable expectations at this particular time, but our opinions are not offered as predictions or assurances that particular events will occur.