March 3, 2025
By Adam Ducker, CEO, RCLCO; Mike Weaver; Grace Amoh, Senior Associate, RCLCO
Originally published via ULI
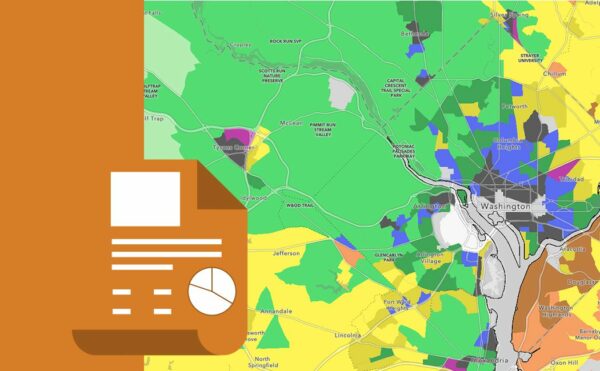
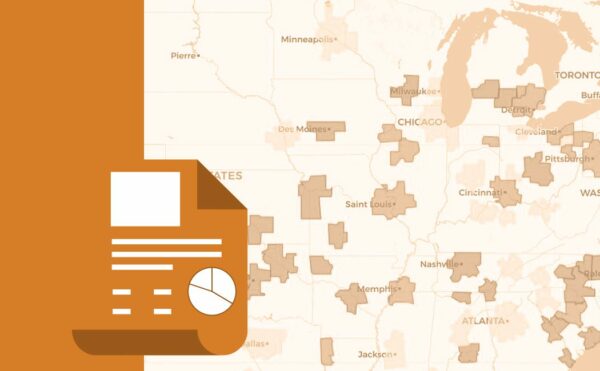
The Urban Land Institute (ULI) and research partner RCLCO, released the ULI Terwilliger Center for Housing’s 2025 Home Attainability Index, a data-rich tool measuring affordability, connectivity, racial disparity, and growth across the United States at the MSA, county, and census tract levels. Featuring data visualization tools that allow users to explore both national and regional trends, this platform serves as an invaluable resource for industry professionals tackling today’s most pressing housing production, policy, and financing challenges.
The data can help:
- Identify gaps in home attainability and provide better context to understand residential markets
- Explicitly identify and highlight racial, socioeconomic, and intraregional disparities and inequities
- Enable national and regional comparisons to inform housing production, policy, and financing decisions
Building on previous years, the innovative new web app offers cutting-edge capabilities, including the ability to conduct comparative change-over-time data analyses. The 2025 iteration includes updated data, an easy-to-use Excel tool, and a comprehensive interactive map that tracks housing data at the tract, county, and MSA levels.
Key Findings
Cost burden is increasing across the country
In nearly every major market across the United States, households earning under $50,000 are significantly more cost-burdened than they were 10 years ago. This lends quantitative support to what Americans are already feeling: Every region of the country is growing more unaffordable. By spending over one-third of their income on the cost of renting or owning, it is becoming increasingly difficult for low- and moderate-income households to pay for other life necessities or even make ends meet. The nationwide affordability crisis is continuing to worsen, and concerted efforts to increase the country’s housing stock are needed at all levels of government to reverse this trend.
Housing attainability varies widely by region
Home prices and rents are rising dramatically in certain US markets, while stabilizing in others. For instance, households in the Rust Belt earning 120% AMI have ample opportunity to purchase homes, while household in in the West even with above average incomes have few options. Additionally, rents in large metro areas and western markets can easily be double or triple the cost compared to smaller, midwestern cities. Housing costs have always driven migration patterns in the U.S. and the most recent data suggests that housing cost in high growth markets like the Southeast and Intermountain West are beginning to redirect growth.
The affordability crisis is spreading inland
Historically, dramatic changes in affordability have been confined to competitive coastal markets, but the data indicates that this trend is now spreading inland. From 2020-2023, the cost to purchase a home in several northwestern United States markets – including Jackson Hole, Wyoming; Boise, Idaho; and Bozeman, Montana – rose by 50 percent, the highest increase in housing cost throughout the country. This enormous price surge – occurring just over a few years – is forcing the local low- and moderate-income populations out of their communities overnight. Once uncharacteristic for the region, the rising prices highlight the consequences of sidelining affordable housing production and underscore that no part of the country is immune to the ongoing nationwide affordability crisis.
Rent increases are limited where housing production has increased
Markets across the United States with significant housing production have experienced more limited rent growth. Austin, Texas; Nashville, Tennessee; and Raleigh, North Carolina are among the top 15 markets for new housing built relative to their size, and all three metro areas have seen the least rent growth relative to their peer markets where less development has occurred.
Homeownership remains racially unequal
In every market analyzed across the United States, white households are more likely to own their homes than Black households. The gap is greatest in markets located in the North and Southwest, each at 35.8 percent, and smallest in markets located in the Sunbelt and West, at 26.6 percent and 28.5 percent, respectively. Some cities – like Scranton, Pennsylvania, and Portland, Maine – have racial homeownership gaps of more than 50 percent. The data demonstrate that despite the existence of government-backed downpayment assistance programs, the policies in place to assist first-time homebuyers fall short of closing the racial disparities in the homeownership gap.
Housing development is concentrated in the suburbs
While most Americans live in the suburbs, following the 2010s – a period of strong housing activity in America’s urban cores and inner suburbs – activity has moved back to the suburban edge as builders chase more affordable land and construction types that lower the cost of production.
Commute times are increasing
Markets that have historically had shorter drive times – such as Raleigh, North Carolina – are now seeing more traffic even compared to the pre-COVID period. The findings lend support to the decision of more major cities across the United States, most recently New York City with the enactment of its pivotal congestion pricing law, to pursue policies and design approaches aimed at reducing car traffic, including curb extensions, bike lanes, and subsidized transit passes.
Full access to the interactive tool can be found on ULI’s Knowledge Finder.